Analysing coverage
Introduction
In the previous post we set up KLEE and did a test against various softwares.
Although it was able to attain 100% coverage on small toy softwares, it seemed to struggle against production level complex libraries, completing no paths and only exploring about 30k paths in 10 mins(vs 450k paths against coreutils echo in the same timespan).
We speculate the problem to be with our harness being too restrictive, as well as the size of the symbolic buffer being too large.
In this post, let’s measure the coverage of the run and see exactly which part of code was exercised, and the actions we should take for a more wholesome symex session.
klee-stats
klee-stats is a tool that comes with klee to describe the instruction and branch coverage of a klee run.
1 | klee@9523002f7332:/host/test5/libxlsxwriter/lib$ klee-stats klee-out-1 |
When used with the --libc=uclibc option, these data are of little value because library functions are counted in the overall coverage calculation too, resulting in a usually less than 20% coverage.
kcachegrind
kcachegrind is a separate GUI tool to visualise coverage, and can be installed via your regular package manager.
Periodically during every klee session, a run.istats file is dropped into the output directory. This file contains coverage information for that particular klee run.
We can open it up in kcachegrind to view coverage and call graph.
1 | awae@ubuntu:/mnt/hgfs/klee/test5/libxlsxwriter/lib$ kcachegrind klee-out-1/run.istats |

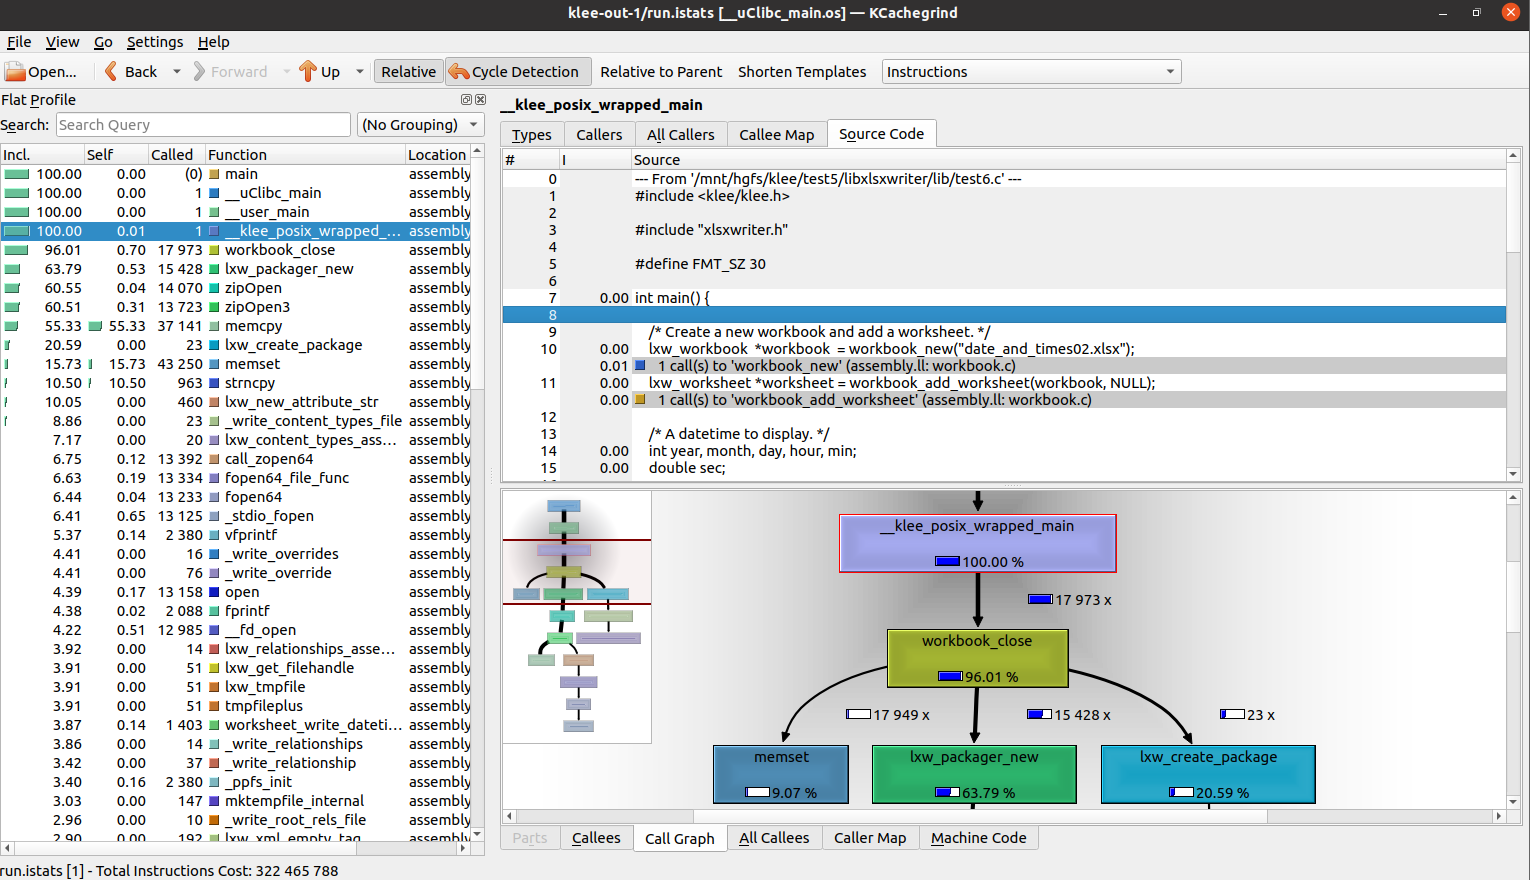
In the left column we see a list of function names, including those from our harness, the libxlsxwriter library and also uclibc.
Incl. shows the percentage of all instructions called from that function, including child functions. Obviously functions like main have 100%.
Self shows the percentage but not including child functions.
The panes on the right shows the section of source code relevant to our current display, which is Instructions as shown on the top right hand corner.
Source code have to be added manually via Settings->Configure KCachegrind->Annotations
The bottom pane shows a call graph.
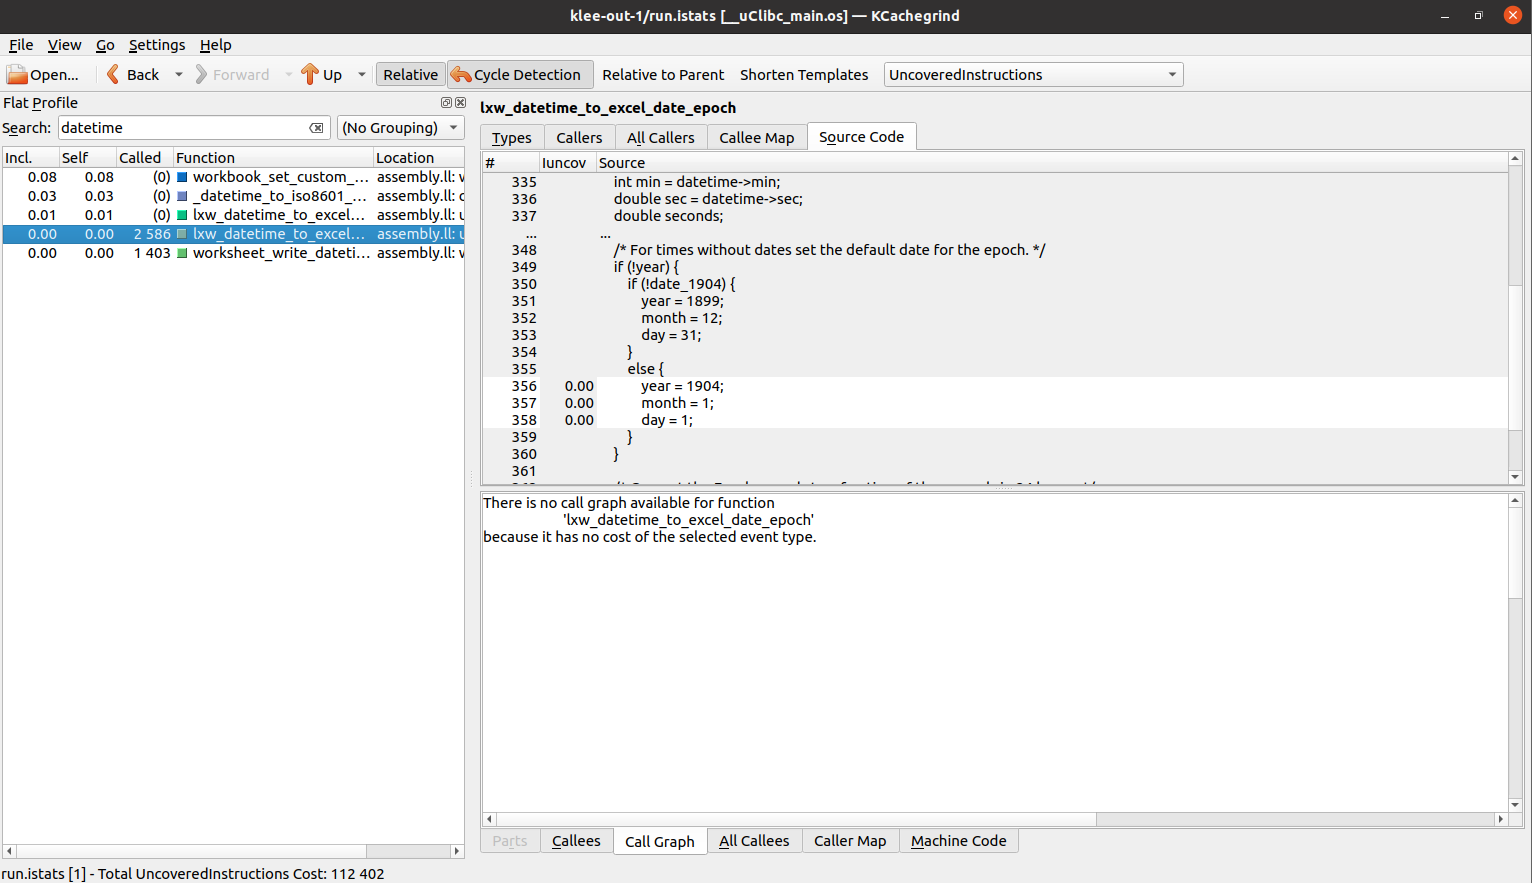
We can change the selection by clicking on the currently selected Instructions tab, and changing it to UncoveredInstructions

We search for the buggy function from the previous post, and find these 3 lines of code highlighted in white uncovered. The remaining highlighted code are for context.
The reason is because when worksheet_write_datetime calls this function, it passes in a constant LXW_EPOCH_1900, which always sets the variable date_1904 to false.
1 |
|
Note: The highlights are quite buggy when multiple context lines are displayed. I recommend setting it to 0 to note the lines not executed, then using a separate code browser to view the annotations.
Example:

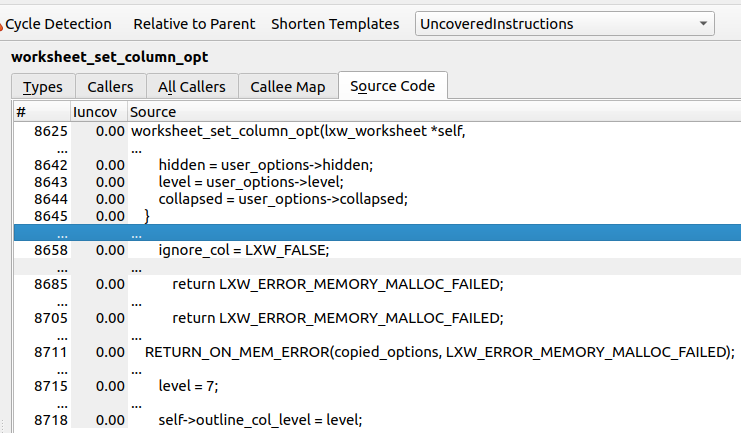
This is much clearer as it only displays uncovered lines.
Another major function our harness fuzzed was the worksheet_set_column_opt function.

Inspecting the coverage output reveals that both functions were fuzzed very comprehensively, and no functional pieces were left out. We can conclude that the harness worked well, but the design of the harness only allowed us to target these two functions.
Knowing this, we can employ another technique, bottom up fuzzing.
Bottom Up Approach
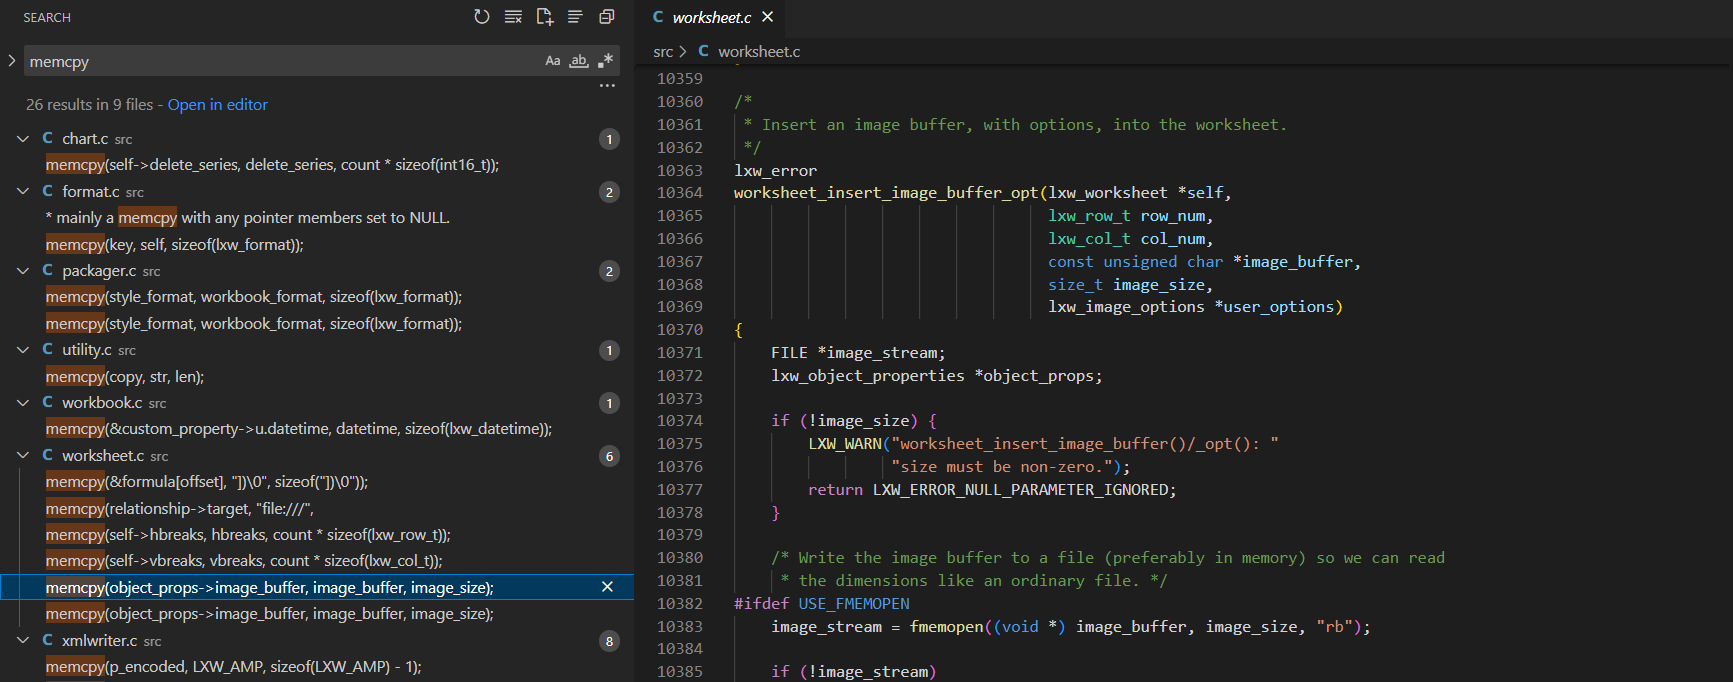
Instead of trying to write an all comprehensive harness and let KLEE do the work, we can use static analysis to find potentially dangerous functions such as memcpy, and instruct KLEE to explore that specific function.
For example:

We find an insert image function that invokes memcpy based on an image buffer. This also calls into a tiny image verifier, which we can potentially fuzz.
Spoiler: I’ve tested this and there are no bugs, so not gonna write about it here.
You can also test small, independent helper functions by copying them out separately.
For example:
1 |
|
Here we copied the implementation of the _escape_attributes function to test independent of the libxlsxwriter library. A bug in KLEE exists(since 2016!) such that the individual members of a struct can’t be made symbolic(https://github.com/klee/klee/issues/429). The workaround is to make the entire struct symbolic, then concretize individual members.
These are just some of the approaches you can take when performing analysis with KLEE.
I did mention exploring binary-only symbolic execution with https://github.com/lifting-bits/mcsema , but I realised that it requires IDA Pro and it’s probably not wise to demonstrate with a cracked version.
Thus, this will be left as homework for the reader lol.
Conclusion
This ends off the 4 part exploration of symbolic execution!
Just to recap, we talked about Symbolic Execution in theory in the first part, discussed the specific design of a widely used symbolic execution engine in the second, used the engine against a variety of toy and production level binaries in the third, and analysed the different coverage metrics the engine had provided to us as well as discuss the varying approaches to perform symbolic execution in this last part.
Here are some takeaways from this part:
Keep your symbolic buffers small, if not the solver will hit the memory cap super fast and mess with the whole session.
“Completed Paths” does not always mean good coverage. The engine might be dying at trying to analyse the final cleanup function, which often is not your goal. Always check code coverage using kcachegrind periodically, as KLEE updates the run.istats file once a while.
The bottom up approach, combined with static analysis is usually the most effective way to utilise a symbolic execution engine.
The next post will be a start to a new series, where we analyse the interior workings of AFL, and fuzz some Windows binaries with WinAFL.
..
