Writing a static binary instrumentation engine
Introduction
As mentioned in previous posts, the theme of 2023 for this blog is fuzzing. We’ve looked at fuzzing papers, tools, source code, application. What better way to finish the year than to write our own fuzzer? If you’ve read Fuzzing 5, it should be clear that the core of a smart fuzzer is its instrumentation engine. This post will detail the steps and logic to write your own SBI engine from first principals. The end product will be a fast and dirty tool that works with WinAFL out of the box, supports kernel and usermode fuzzing, supports x64, and has minimal overhead.
Why
I realised that none of the open source fuzzers existing could fuzz the Windows kernel with ease.
Hypervisor based fuzzers like wtf or the underlying WHv APIs don’t support device emulation, which meant that you have to write a bunch of hooks to implement something like special pool, which is absolutely vital during fuzzing. Fuzzers that do support full device emulation such as kAFL runs on bare-metal linux, is extremely tedious to get working for Windows, and is very slow compared to native execution.DBI is out of the question because trying to rewrite a loaded driver’s memory is going to give a lot of problems(especially when other processes are interacting with it), affects performance severely(think of all the hooks if you’re doing a hook based implementation), and provides no benefits compared to SBI. Usermode fuzzers probably use DBI only because robust frameworks like Dynamorio already exist for other purposes, and can be repurposed for fuzzing.
Hardware based solutions like IntelPT doesn’t provide edge coverage out of the box and thus require additional parsing of the instruction trace. Furthermore if the target performs DPCs or other callbacks that can run in arbitrary thread contexts, we can’t do process/thread based filtering and will have to parse a huge instruction buffer generated by all processes.
This leaves us with SBI :)
Existing Solutions
Perhaps the most well known SBI implementation for Windows kernel is pe-afl by Lucas Leong. Unfortunately this tool only supports 32-bit programs, and is pretty much unusable on modern Windows.
There exists a 64-bit patch peafl64 by Sentinel One. Maybe it works, maybe it doesn’t, but it didn’t work for me and I hate debugging other people’s code, and I suspect that it is overly complicated(sorry Sentinel One). For small projects I prefer writing the main logic from scratch so it’ll be easier to modify in the future. That being said I did use bits and pieces of code from peafl64, especially the ida_dumper.py script and pefile.py which are well made.
First Principals
Let’s go back to the dogma of AFL, which can be described in 3 lines of code.
1 | cur_location = <COMPILE_TIME_RANDOM>; |
The rationale behind this snippet has been explained in Fuzzing 2. All that’s important is this snippet logs edge coverage to shared_mem, which AFL can consume to make mutation decisions. The original AFL modifies a compiler to inject this snippet to every branch target during compile time.
Since we don’t have source code, we’ll need to inject this snippet to every branch target after compilation is done. This can be further split into tasks such as finding all branch targets(basic blocks), expanding those basic blocks to make space for instrumentation shellcode, fixing offsets of instructions and so on. This is tougher said than done, since we have IDA to provide us with relevant offsets. But first let’s convert the above pseudocode into shellcode.
Shellcode
Original AFL allocates a 0x10000 sized buffer at the .cov section, and the coverage is logged there.
However WinAFL already pre-allocates a shared memory buffer for coverage, and the harness is supposed to map the buffer into its process, then copy the coverage bytes over.
1 | shm_handle = CreateFileMapping( |
As per original pe-afl implementation:
1 | memcpy(shared_mem, COV_ADDR, MAP_SIZE); |
I thought this was rather redundant, and the copy contributes to 4% of one cycle’s execution time when tested against a fast processing binary.
Instead, my .cov section only contains a pointer to the shared memory section, which will be filled by the harness. If the pointer is not present, the shellcode will terminate and not log coverage. Otherwise it will log coverage directly to shared memory.
1 | # Shellcode that only updates coverage bitmap if the current pid matches the harness's pid |
For kernelmode targets we’ll use a driver to map the coverage buffer into nonpaged memory, before writing it to .cov section. This is because the shellcode may be executed while its IRQL >= 2, and we can’t afford a page fault.
With the shellcode ready, let’s see how we can extract crucial information from the binary using IDA.
ida_dumper.py
As mentioned above we’re interested in information such as basic-block(BB) addresses, instructions with relative/rip-relative offsets etc.
The original script by Sentinel One is quite clear, and I’ve only made slight changes to it. One of the changes is collecting targets of jmp addresses as basic blocks.
1 | # skip calls |
Sentinel One researchers feel that unconditional jumps should not be regarded as a change in basic block. However I’ll need this information when expanding short jumps to near jumps, as explained in a later section. This does not affect coverage at all so it’s fine.
In the end we’ll have the following information from the binary:
- basic blocks start
- functions start and end
- relative instructions
- rip-relative instructions
- exception handler addresses
These information are enough to instrument most normal binaries.
Flow
1 | orig_binary_path = sys.argv[1] |
If we expand the basic blocks in place, we’ll have a lot more trouble to deal with, such as the relocation table and import table. An easier way is to leave the original sections alone and clone all executable sections to the end of the binary, after all the data sections. This way we can expand the cloned sections as large as we want, while all references to data sections are still valid.
Cloning Sections
1 | for orig_sec in g_binary.sections.copy(): |
For all executable sections, we’ll make a new section at the end of the binary with the same properties, but a larger size. This is to make space for all the instrumentation shellcode about to be added.
1 | # Get some space for CFG table |
We also make a .cfg section to house a new CFG table(because we will add more functions to it and the original one is too small), as well as a .cov section.
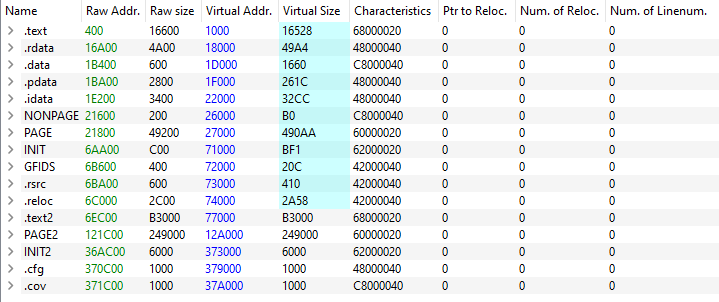
If the binary has too many executable sections, the original section table may not be able to hold the information, and it will overflow into the first section of the binary.
We should be aware of this and save some bytes before cloning the sections:
1 | # first save some bytes from the first section, in case section table overwrites into it |
Injecting Instrumentation
First challenge is determining the size of a BB, since IDA doesn’t tell us about it. I take the size as the delta from one BB to the next, except for the last BB of the section.
1 | if bb_idx + 1 == len(g_ida_data["bb"]): |
Then we figure out where to slot the instrumented BBs.
1 | orig_section = GET_SEC_BY_ADDR(self.orig_rva) |
For BBs in the same section we simply stack them contiguously in memory.
One problem is that valid Control Flow Guard(CFG) targets should have a 16-byte alignment, otherwise the loader will reject it. We deal with this by padding every BB with nops after instrumentation.
1 | self.data += b"\x90"*(0x10-len(self.data)%0x10) # 16 byte align |
First up is replacing the magic bytes in shellcode.
1 | # replace magic in shellcode |
The shellcode uses rip-relative instructions to retrieve coverage pointers, which means we don’t have to deal with the .reloc table(for hardcoded absolute addresses) and can simply replace the address part.
Then we enumerate all instructions residing in the current BB.
1 | # get all relatives and rip_relatives in current BB |
We can’t actually fix their destination now, because the size and offsets of other BBs are still not determined. Instead we just expand their sizes and pad the destinations with dummy values. This is just to calculate a final size for the BB after instrumentation.
Instructions that require expansion are those that take in a one byte offset as destination(for example JE rel8). These instructions only support referencing an offset of -127/+128, which may not be enough after injecting instrumentation.
A part of it:
1 | if ins_operator > 0x6f and ins_operator < 0x80: |
We collect the destination of jmp instructions with ida_dumper.py so we can expand them as well.
The same is done for rip-relative instructions, but those are much easier since we just need to replace the destination bytes and don’t have to expand their sizes.
Since instructions are expanded in place, we’ll need to keep track of expanded sizes so we can correctly retrieve the next instruction.
1 | ins_offset = increased_size + (ins.ins_loc - self.orig_rva) |
The end product is a list of INS objects that describe an instruction.
1 | class INS: |
Every BB will store such a list, and these instructions will be fixed after all BBs are expanded as above.
1 | for bb in g_bb_list: |
Finally we write the BBs into their relative sections in the binary.
1 | for bb_idx in range(len(g_bb_list)): |
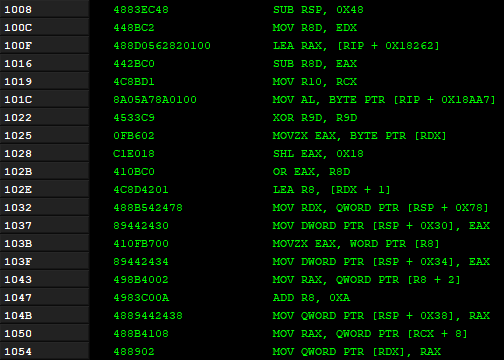
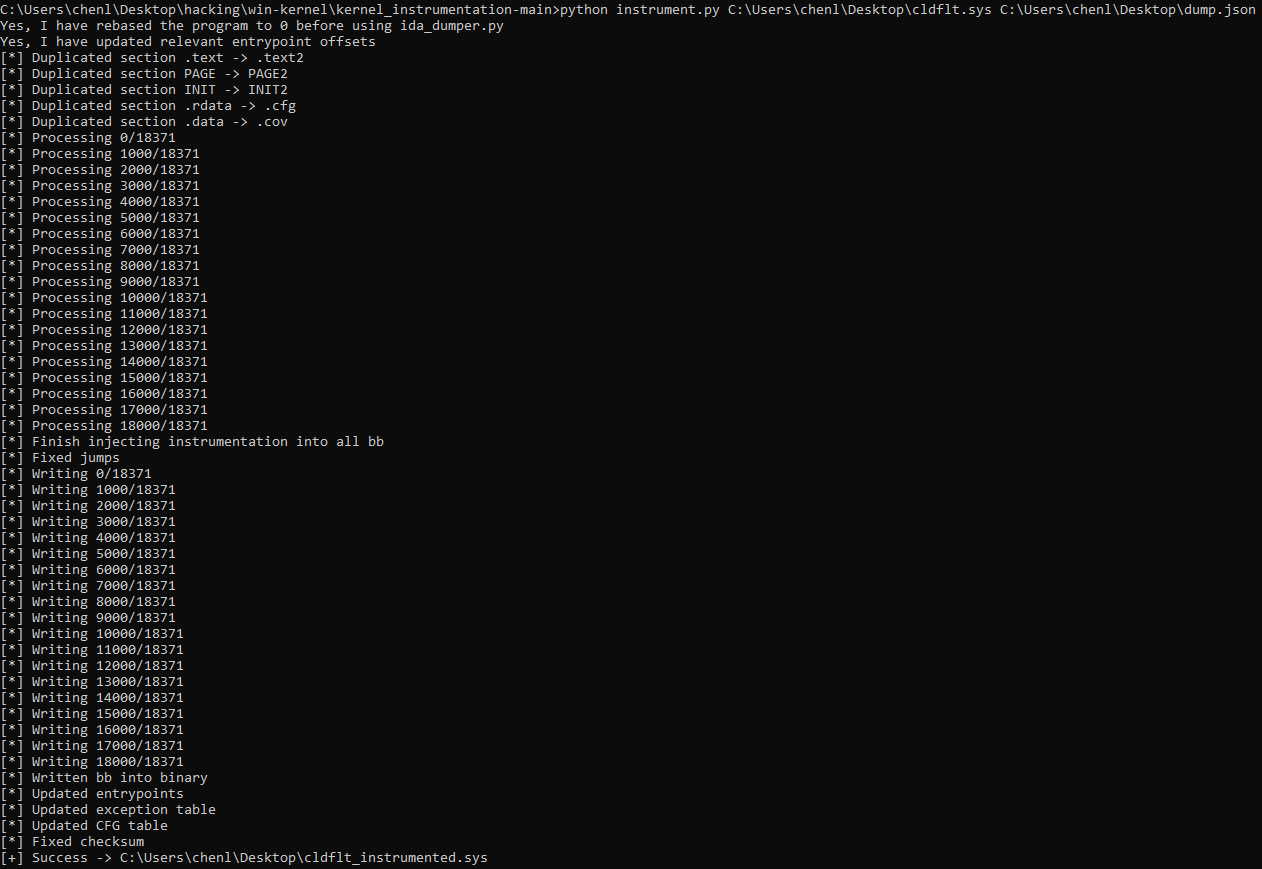
Let’s take cldflt.sys as an example.
Before instrumentation:
Instrumenting:
After instrumentation:
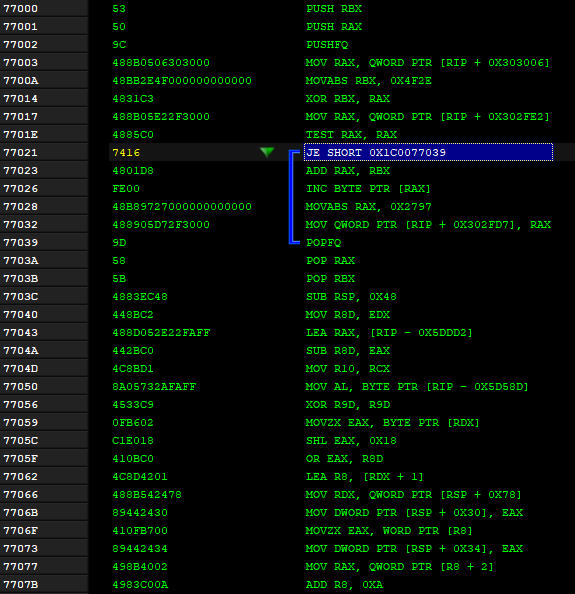
All code remains the same, just instrumentation added before every basic block.
Fix Entrypoint
This is the most important step.
If the entrypoint is not patched, it will call the uninstrumented main instead, and all function references(IRP handlers/callbacks) will point to the uninstrumented section.
Since we’ve collected the destination of jump targets, jmp instructions will be patched as well and we can safely update the entrypoint pointer in the PE’s optional header.
If you don’t treat jumps as a change of basic block, the mainCRTStartup function in CRT linked executables will end up calling the uninstrumented __scrt_common_main_seh, which will reference the uninstrumented main function.
We can patch that by replacing all references to the main function with the instrumented main.
1 | new_main_rva = bb_get_new_addr_from_old(orig_main_rva) |
Fix Exception Handlers
Exceptions are quite pesky on Windows, especially when you have code written in C++ and C.
For starters we have the __C_specific_handler for __try statements. Then we have __GSHandlerCheck for functions with stack canaries enabled. Then we have __GSHandlerCheck_SEH for __try statements within functions with stack canaries. Then there is __CxxFrameHandler3 and __CxxFrameHandler4 for C++ try statements. Finally there is __GSHandlerCheck_EH for C++ try statements withint functions with stack canaries.
All of these have custom implementation formats that require custom patching to work, otherwise you’ll get false positives like a crash that should be handled by an exception handler.
Good news is kernelmode does not support C++ exception handling, and C++ style try will be compiled as __C_specific_handler. So we only really have 3 handlers to deal with: __C_specific_handler, __GSHandlerCheck and __GSHandlerCheck_SEH.
The exception table looks like this:
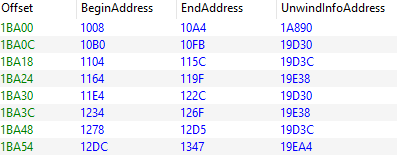
BeginAddress and EndAddress specifies the start and end of a function that requires exception handling. UnwindInfoAddress points to an UNWIND_INFO struct.
1 | typedef struct _UNWIND_INFO { |
If the flags contain UNW_FLAG_EHANDLER or UNW_FLAG_UHANDLER, then the ExceptionHandler and ExceptionData member is present.
If the flags contain UNW_FLAG_CHAININFO, the BeginAddress EndAddress and UnwindInfoAddress of a previous unwind info structure is stored after UnwindCode instead.UnwindCode is always a multiple of 2.
For __C_specific_handler, the ExceptionData contains a SCOPE_TABLE structure:
1 | typedef struct _SCOPE_TABLE { |
This BeginAddress and EndAddress specifies the part of code inside the __try block. The HandlerAddress points to the function within the __except() parenthesis, or just 1 if EXCEPTION_EXECUTE_HANDLER is specified. It also points to the code inside the __finally block if that exists. JumpTarget points to code inside the __except block if it exists, otherwise it’s 0.
__GSHandlerCheck contains some GS specific data, which does not require patching.
__GSHandlerCheck_SEH contains a SCOPE_TABLE followed by GS specific data so we just need to patch the scopetable. (Edit: Looking back at it, we do need to patch GS data if it’s together with SEH, otherwise some deterministic crash will happen in RtlUnwindEx. But I don’t care if the stack canary is corrupted or the return pointer is corrupted. Both will reflect as a crash, and both are considered bugs to me. So I just forcefully replace all __GSHandlerCheck_SEH with __C_specific_handler.)
1 | while start_raw < end_raw: |
Exception related data is stored in an ExceptionAddressUpdateInfo class:
1 | class ExceptionAddressUpdateInfo: |
This allows us to patch the exception addresses after all BBs are instrumented.
Fix CFG
CFG is rather easy to fix.
We just append the instrumented function addresses to the GuardCFFunctionTable.
The reason why we don’t update the table in place is to support partial instrumentation, where some functions may be left uninstrumented in the original section.
The CFG table has to be sorted in ascending order, so that will cause some issues.
Code to calculate the size of each CFG’s entry can be found on MSDN.
1 | start = g_binary.DIRECTORY_ENTRY_LOAD_CONFIG.struct.GuardCFFunctionTable - g_binary.OPTIONAL_HEADER.ImageBase |
Helper Driver
For kernelmode fuzzing we’ll need a driver to update the .cov section.
I just wrote a simple one to perform read/write/map/unmap, nothing special.
1 | case IOCTL_HELPER_READ_VM: |
WinAFL Header
We can modify the syzygy header that comes with WinAFL.
On startup:
1 | // Create handle to helper driver |
On exit:
1 | if (g_current_iterations == g_niterations) { |
It’s also important to clear prev_loc after every iteration so coverage doesn’t get messed up.
Crash Detection
This is not an issue for kernel mode fuzzing, because the system bluescreens on a “crashable” bug and we can’t do much. However since I want my fuzzer to fuzz usermode as well, this is an important topic to consider. It turns out that crashes on Windows are inconsistent as well, and there’s no one fit solution for it.
For starters, please read this and this to understand why we can’t easily catch all Windows crashes.
There are two possible methods(that don’t rely on external telemetry such as WER): to use SetUnhandledExceptionFilter or AddVectoredExceptionHandler. The latter is used by the original syzygy, peafl as well as peafl64.
Handlers registered by AddVectoredExceptionHandler can catch most of the interesting crashes on Windows. However, they supersede frame based handlers, so you get false positives that winafl reports as a crash but the program actually handles it with SEH for example. You may think this is not a big deal, but if the target constantly throws exceptions and handles them, the harness will report all of these as a crash to winafl, and by design winafl will terminate and restart the target process(makes sense because these exceptions are unrecoverable). This renders persistent mode useless, significantly hindering efficiency.
To eliminate false positives, you can use SetUnhandledExceptionFilter to register your handler. This way the handler is called only when no other frame based handlers can handle the exception(i.e. unrecoverable crash), and you can be sure it is not a false positive. Unfortunately, such a handler does not catch stack overflows or STATUS_HEAP_CORRUPTION exceptions as mentioned in the links above. So, we get false negatives instead.
False positives are undesirable, but false negatives are completely unacceptable. In the end I choose to stick with AddVectoredExceptionHandler, but I’ll be conscious to check if the target throws exceptions frequently.
If that’s the case I’ll manually exclude the crash site:
1 | // |
This is quite dumb, but I can’t just exclude all crashes if they occur more than a certain number of times, because invoking the default crash handler is more expensive than just terminating the process.
If the reader has a better solution and doesn’t mind sharing, I’ll be happy to discuss!
Test
Example vulnerable driver:
1 | switch (irpSp->Parameters.DeviceIoControl.IoControlCode) { |
Harness:
1 | int main(int argc, char **argv) |
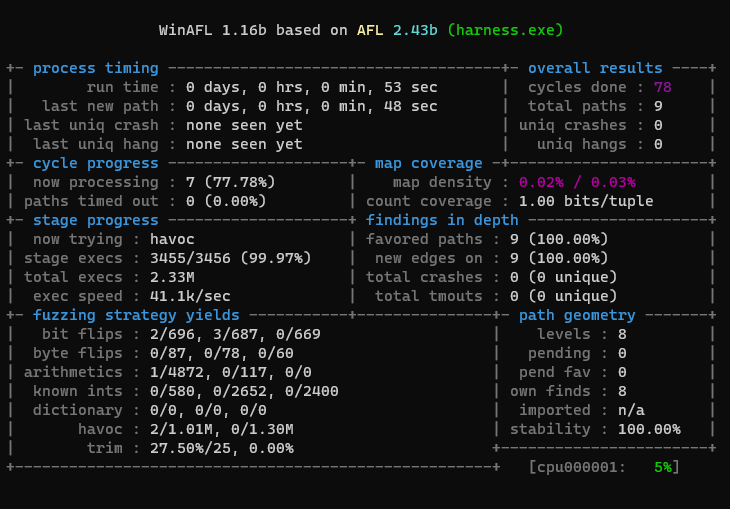
For this small test driver we achieve 100% stability and ~40k execs/s, which is really nice. If we copy the coverage buffer manually every round like the original peafl, we’ll only get ~30k. If we do file based sample delivery instead of shared memory we’ll get ~1k, because file ops are really expensive.
Crashing Sample Extraction
Now assuming we attach WinDbg to the fuzzing VM and caught a crash. How do we extract the crashing sample?
We can log the sample to disk before running, but that requires opening the file with FILE_FLAG_NO_BUFFERING. Otherwise the sample will not be flushed to disk immediately, and when the kernel crashes it will be lost. Disabling buffering not only requires us to perform file operations in multiples of 512 bytes, but also results in a huge performance decrease. For the test driver above, logging the sample to disk reduces the efficiency to ~7k execs/s, which is too much of a trade-off in my opinion.
What if we extract the sample directly from the shared memory using WinDbg when the kernel crashes?
1 | 0: kd> !vad |
We know that the shared memory is backed by the pagefile, has READWRITE permissions, and its mapped size is fully determined by the harness.
Judging from the output above, the shared memory containing the crashing sample is most likely page 0x2507b870, which corresponds to address 0x2507b870000
1 | 0: kd> dc 0x2507b870000 |
Indeed, it contains the size and bytes of the crashing sample.
Here’s a python script to automate:
1 | import sys |
Where Fuzzer?
The fuzzer has not gone through extensive testing, and only works for well-behaved Microsoft released binaries at the moment. I’m certain there are edge cases to be supported, and will release it after it reaches a decent level of robustness.
Conclusion
It’s been a fun year studying fuzzing and Windows internals.
I’m happy to make something that reinforces my understanding and is actually useful for my daily work!
